July 24, 2014 via NASA
A new study by NASA and University of California, Irvine, scientists finds more than 75 percent of the water loss in the drought-stricken Colorado River Basin since late 2004 came from underground resources. The extent of groundwater loss may pose a greater threat to the water supply of the western United States than previously thought.
This study is the first to quantify the amount that groundwater contributes to the water needs of western states. According to the U.S. Bureau of Reclamation, the federal water management agency, the basin has been suffering from prolonged, severe drought since 2000 and has experienced the driest 14-year period in the last hundred years.
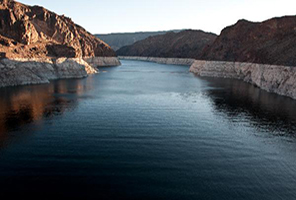
Image Credit: U.S. Bureau of Reclamation
“We don’t know exactly how much groundwater we have left, so we don’t know when we’re going to run out,” said Stephanie Castle, a water resources specialist at the University of California, Irvine, and the study’s lead author. “This is a lot of water to lose. We thought that the picture could be pretty bad, but this was shocking.”
Water above ground in the basin’s rivers and lakes is managed by the U.S. Bureau of Reclamation, and its losses are documented. Pumping from underground aquifers is regulated by individual states and is often not well documented.
“There’s only one way to put together a very large-area study like this, and that is with satellites,” said senior author Jay Famiglietti, senior water cycle scientist at JPL on leave from UC Irvine, where he is an Earth system science professor. “There’s just not enough information available from well data to put together a consistent, basin-wide picture.”
Famiglietti said GRACE is like having a giant scale in the sky. Within a given region, the change in mass due to rising or falling water reserves influences the strength of the local gravitational attraction. By periodically measuring gravity regionally, GRACE reveals how much a region’s water storage changes over time.
The Colorado River is the only major river in the southwestern United States. Its basin supplies water to about 40 million people in seven states, as well as irrigating roughly four million acres of farmland.
“The Colorado River Basin is the water lifeline of the western United States,” said Famiglietti. “With Lake Mead at its lowest level ever, we wanted to explore whether the basin, like most other regions around the world, was relying on groundwater to make up for the limited surface-water supply. We found a surprisingly high and long-term reliance on groundwater to bridge the gap between supply and demand.”
Famiglietti noted that the rapid depletion rate will compound the problem of short supply by leading to further declines in streamflow in the Colorado River.
“Combined with declining snowpack and population growth, this will likely threaten the long-term ability of the basin to meet its water allocation commitments to the seven basin states and to Mexico,” Famiglietti said.
The study has been accepted for publication in the journal Geophysical Research Letters, which posted the manuscript online Thursday. Coauthors included other scientists from NASA’s Goddard Space Flight Center, Greenbelt, Maryland, and the National Center for Atmospheric Research, Boulder, Colorado. The research was funded by NASA and the University of California.
Read the original article at NASA.
For more information on NASA’s GRACE satellite mission, see:
and
http://www.csr.utexas.edu/grace
GRACE is a joint mission with the German Aerospace Center and the German Research Center for Geosciences, in partnership with the University of Texas at Austin. JPL developed the GRACE spacecraft and manages the mission for NASA’s Science Mission Directorate, Washington.
NASA monitors Earth’s vital signs from land, air and space with a fleet of satellites and ambitious airborne and ground-based observation campaigns. NASA develops new ways to observe and study Earth’s interconnected natural systems with long-term data records and computer analysis tools to better see how our planet is changing. The agency shares this unique knowledge with the global community and works with institutions in the United States and around the world that contribute to understanding and protecting our home planet.
To learn more about NASA’s Earth science activities in 2014, visit:
http://www.nasa.gov/earthrightnow
Steve Cole
Headquarters, Washington
202-358-0918
stephen.e.cole@nasa.gov
Alan Buis
Jet Propulsion Laboratory, Pasadena, Calif.
818-354-0474
Alan.Buis@jpl.nasa.gov
Janet Wilson
University of California, Irvine
949-824-3969
janet.wilson@uci.edu
 Sustainability and Decision Center for a Desert City of the Julie Ann Wrigley Global Institute of Sustainability. She holds a PhD in human geography from the University of Bern, Switzerland. Schneider has conducted research on sustainable governance of water and land in Switzerland, Germany and Chile, focusing on multiple stakeholders’ perspectives and values, processes of transdisciplinary knowledge, co-creation through social learning and network building, as well as on issues of power and social justice.
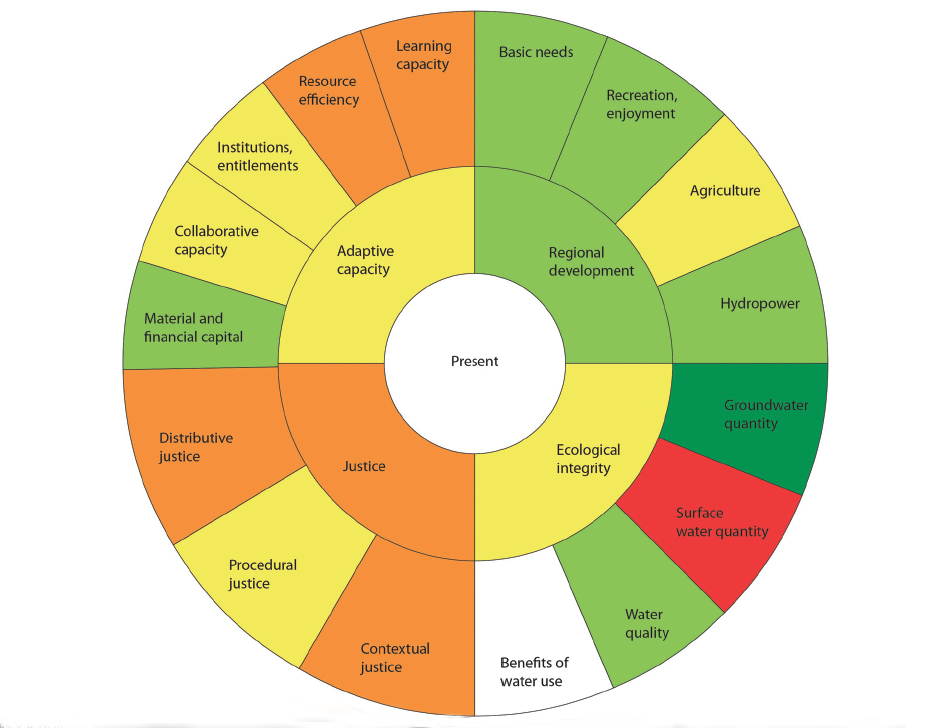 Against this background, our goal is to present a conceptual and methodological approach for an interdisciplinary sustainability assessment for water governance systems – based on what we call the sustainability wheel – and its application in the Crans-Montana-Sierre region of Switzerland, the case study area of the MontanAqua project (Weingartner et al. 2010). For this purpose, we took the basic ideas of the two approaches described above and combined them in a way that would allow the evaluation of the water governance system through a comprehensive, interdisciplinary assessment.
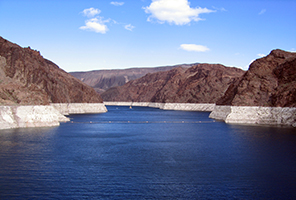 BOULDER CITY, Nev. – Lake Mead, the reservoir created by Hoover Dam, is anticipated this week to reach its lowest water level since the lake’s initial filling in the 1930s. The Bureau of Reclamation’s Boulder Canyon Operations Office is projecting the elevation to drop to 1,081.75 feet above sea level during the week of July 7 and to continue to drop, reaching approximately 1,080 feet in November of this year.